The broker platform for wine & spirits

The field has flipped.
Brokers are the new sales force.

Five years ago, distributor sales reps carried the brands. Today those teams are 15–20% smaller — and suppliers are turning to brokers, especially fast-growing broker groups, to cover their local markets. Ruby is the platform those broker groups run on.

Why now

−15–20%

distributor sales reps over the last 3–4 years

Fewer feet on the street means suppliers must find representation market by market. Broker groups are filling that gap — most of them on Excel, Google Sheets, and QuickBooks.

The market

Who calls on the accounts — then vs. now.

On- and off-premise accounts still get worked every week. What changed is who does the work: distributor field teams have thinned out, independent brokers multiplied, and broker groups — whole teams of brokers under one roof — became the growth story of the last few years.

5 YEARS AGO Distributors owned field coverage DISTRIBUTOR SALES REPS Large, qualified field teams selling the brands their house carried. INDEPENDENT BROKERS A handful of independents working the edges. Most of the field belonged to the distributors. TODAY Coverage has shifted to brokers DISTRIBUTOR SALES REPS Down 15–20% in 3–4 years — far fewer feet on the street. BROKERS Independents — and now fast-growing broker groups. Brokers now carry the coverage suppliers depend on.

Illustrative. With fewer distributor reps, suppliers are under pressure to find representation in every local market — broker groups are filling the gap, and that's who Ruby is built for.

The platform

Everything a broker group runs on, in one system.

How brokers run today

Excel & Google Sheetsactivity tracked by hand — if it's tracked at all
Email attachmentsresults reported to suppliers late, or never
QuickBooksbilling disconnected from the work that earned it

Three tools. Zero connection.

The Ruby broker platform

CRM
CRM — prove the work

Reps log every account visit and result in the field. Suppliers see the activity and outcomes behind every payment — so they stay happy with the representation they're paying for.

BT
Brand Tracker — get active in every market

Before a broker can sell, a lot has to line up: the right supplier conversations, the right brand, the right distributor, a broker assigned. Brand Tracker tracks every step until you're live in the market and ready to sell. See it in action ↓

$
Billing — connected to the work

Invoices flow straight from tracked activity. No re-keying into QuickBooks, no reconciling spreadsheets against payments.

One login. One database. Data goes in once — and reports everywhere.

The Brand Launcher

From signed brand to launched market — every step tracked.

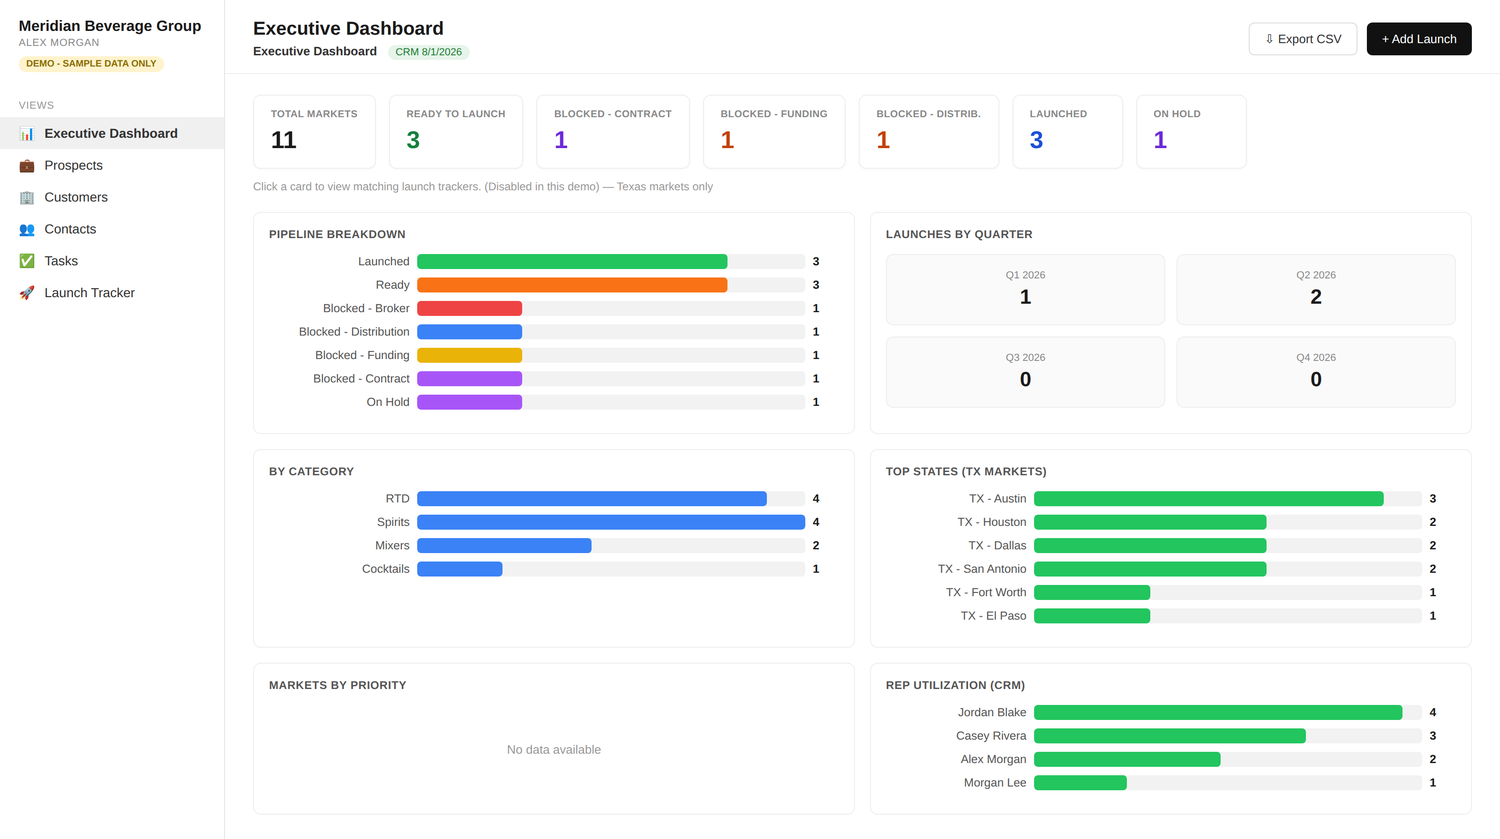
A brand isn't live just because the contract is signed. The contract, the funding, the distributor, the broker assignment — each one can hold up a market, and in a spreadsheet nobody sees which one until it's late. The Brand Launcher gives every brand-market combination a status — Ready, Blocked (Contract, Funding, Distribution, or Broker), Launched, On Hold — so the whole team sees exactly what stands between a brand and its next market.

The Executive Dashboard — the whole launch pipeline at a glance

Eleven Texas markets: three launched, three ready, four blocked, one on hold — broken down by category, market, and rep.

Brand Launcher executive dashboard showing launch pipeline breakdown by status, launches by quarter, category, Texas markets, and rep utilization

Views from the Brand Launcher demo — demo company, sample data only.

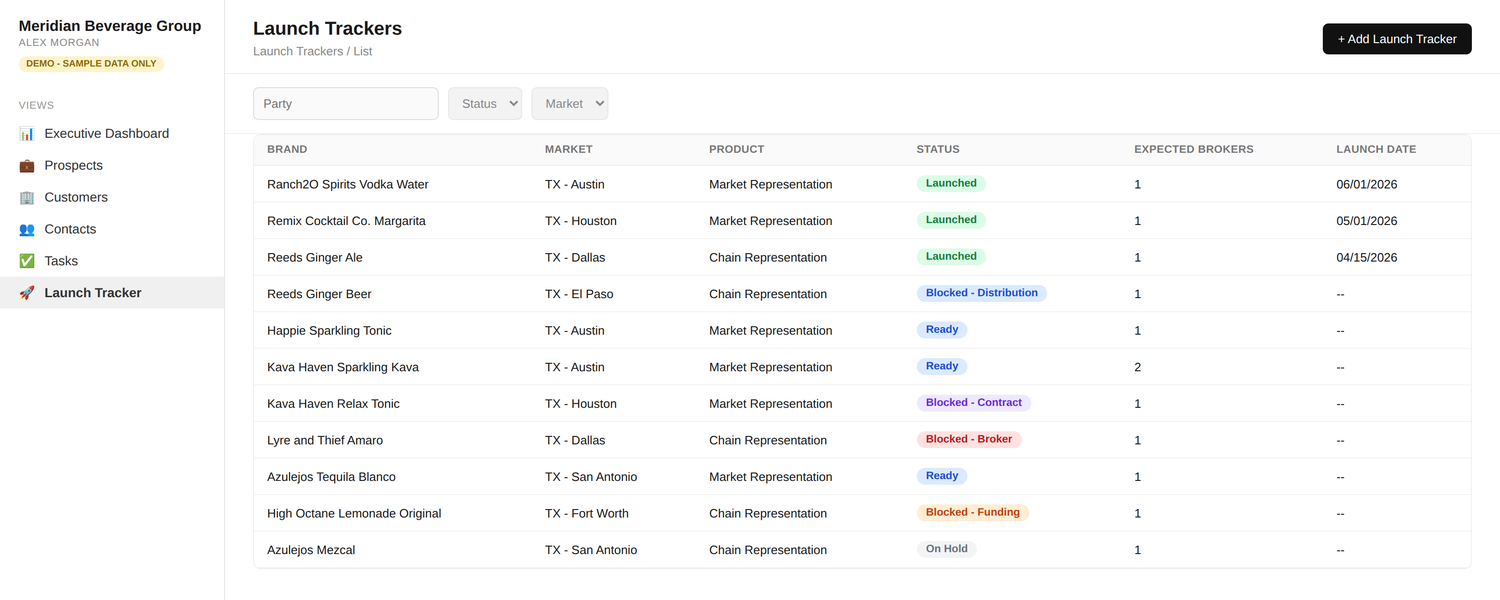
Launch Trackers — one row per brand, per market

Each row carries its status, expected brokers, and launch date — and each blocker names exactly what's in the way.

Launch tracker list showing brands by Texas market with statuses launched, ready, blocked on distribution, contract, broker, or funding, and on hold
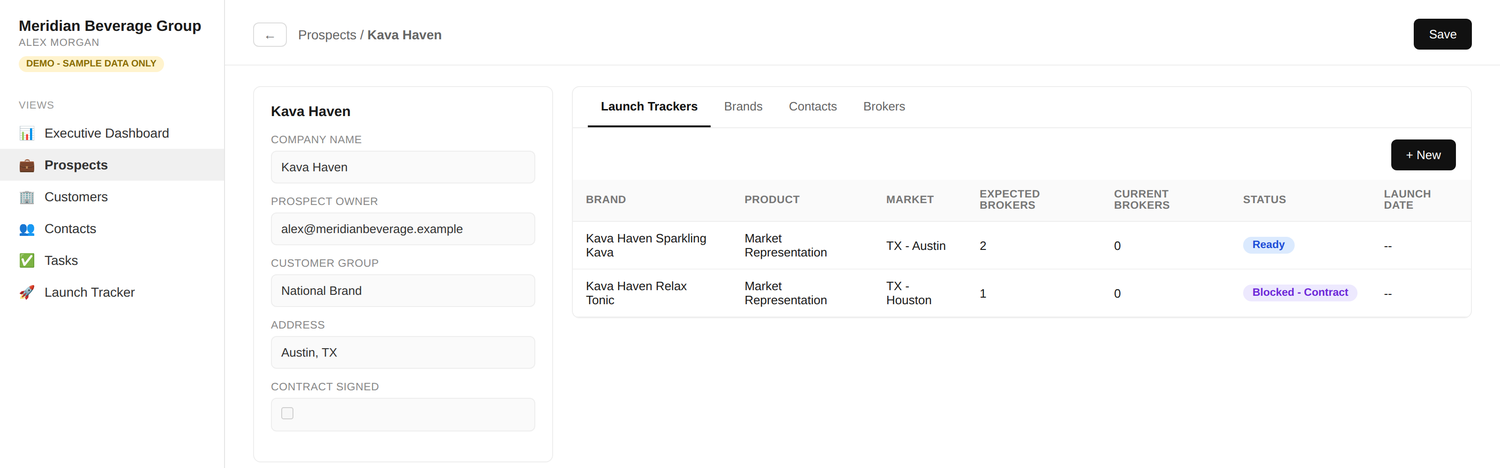
Every supplier's launches in one place

Open a supplier and see their brands, contacts, brokers, and every market they're launching into — with the current status of each.

Supplier detail view with launch trackers tab showing each brand's market, expected brokers, and launch status

How it works — and why it matters

Messy data in, clean supplier reports out. Automatically.

If you run a broker group, you know the problem: the data your brokers send back is messy. Before anything reaches a supplier, someone spends hours — often nights — reorganizing spreadsheets by hand. With Ruby, the broker enters the data once and the platform does the rest.

1
Broker logs the work

Visits, pitches, placements, orders — captured once, in the field, on any device.

2
Ruby splits it by supplier

Every activity is automatically attributed to the right supplier and brand. No manual sorting, no copy-paste between tabs.

3
Suppliers get clean reports

Each supplier sees exactly their brands: the activity, the results, and the wins — sent directly from the platform, beautifully reported.

Billing that matches reality

Every supplier pays differently. Every broker gets paid differently. Ruby tracks both.

Broker billing isn't one price on one invoice. You bill each supplier at a different rate — and you may pay each broker differently depending on the supplier they're working. Tracked in QuickBooks and spreadsheets, that's a monthly headache and an easy place to lose money.

Because Ruby already knows who did the work and which supplier it was for, the invoicing and the broker payouts fall out of the same data — consistent, auditable, and easy to manage.

What Ruby keeps straight

  • ✓ A different billing rate for each supplier
  • ✓ Different broker pay by supplier and market
  • ✓ Invoices generated from tracked activity
  • ✓ A clear audit trail from field visit to payment

Reporting

This is what suppliers actually see.

Reporting is what suppliers really want from a broker — proof the market is being worked. Ruby's reporting comes standard: trends over time, a weekly scorecard, and a live sales pipeline, filterable by supplier, brand, state, and rep.

The Scorecard — one week, one rep, every number

Account activity, in-store wins, goals vs. actual by brand, and the week's case commitments — here filtered to one rep's Texas territory.
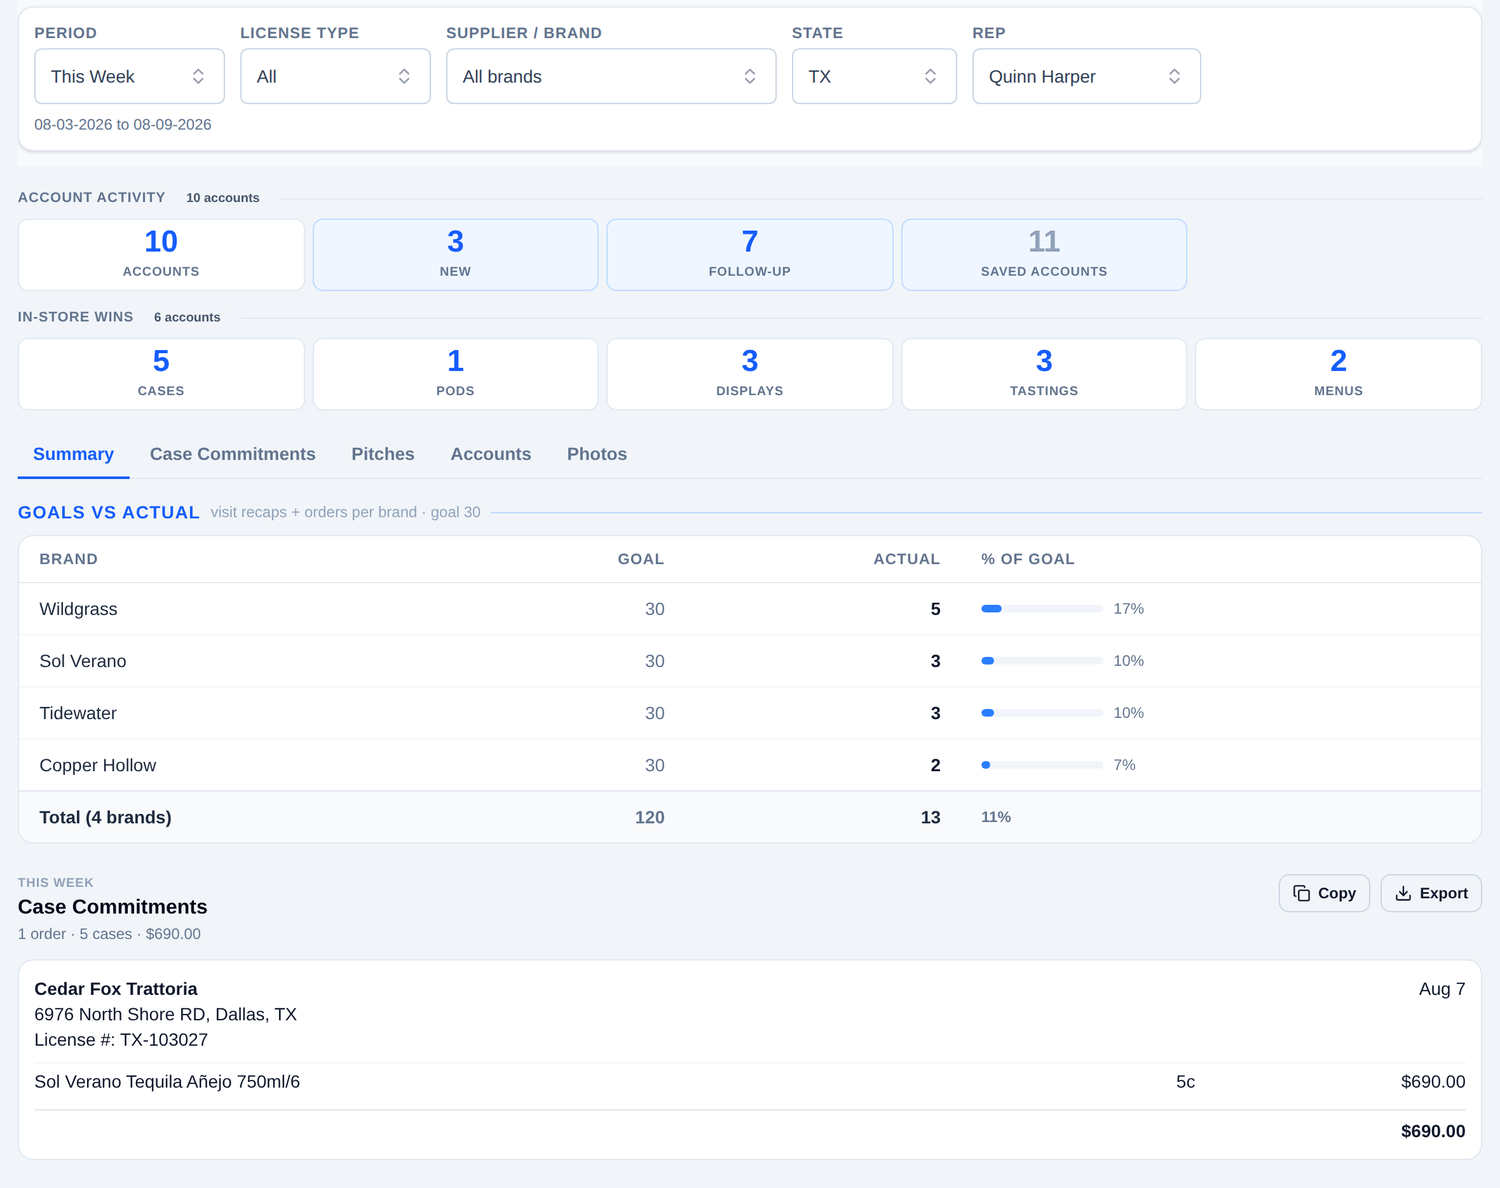
Ruby scorecard report showing account activity tiles, in-store wins, goals versus actual by brand, and case commitments for a single rep in Texas

Live view from the Ruby demo environment — demo company, demo data.

Trends — is the market being worked?

Visit recaps vs. order commitments, week by week. Suppliers watch the activity climb.
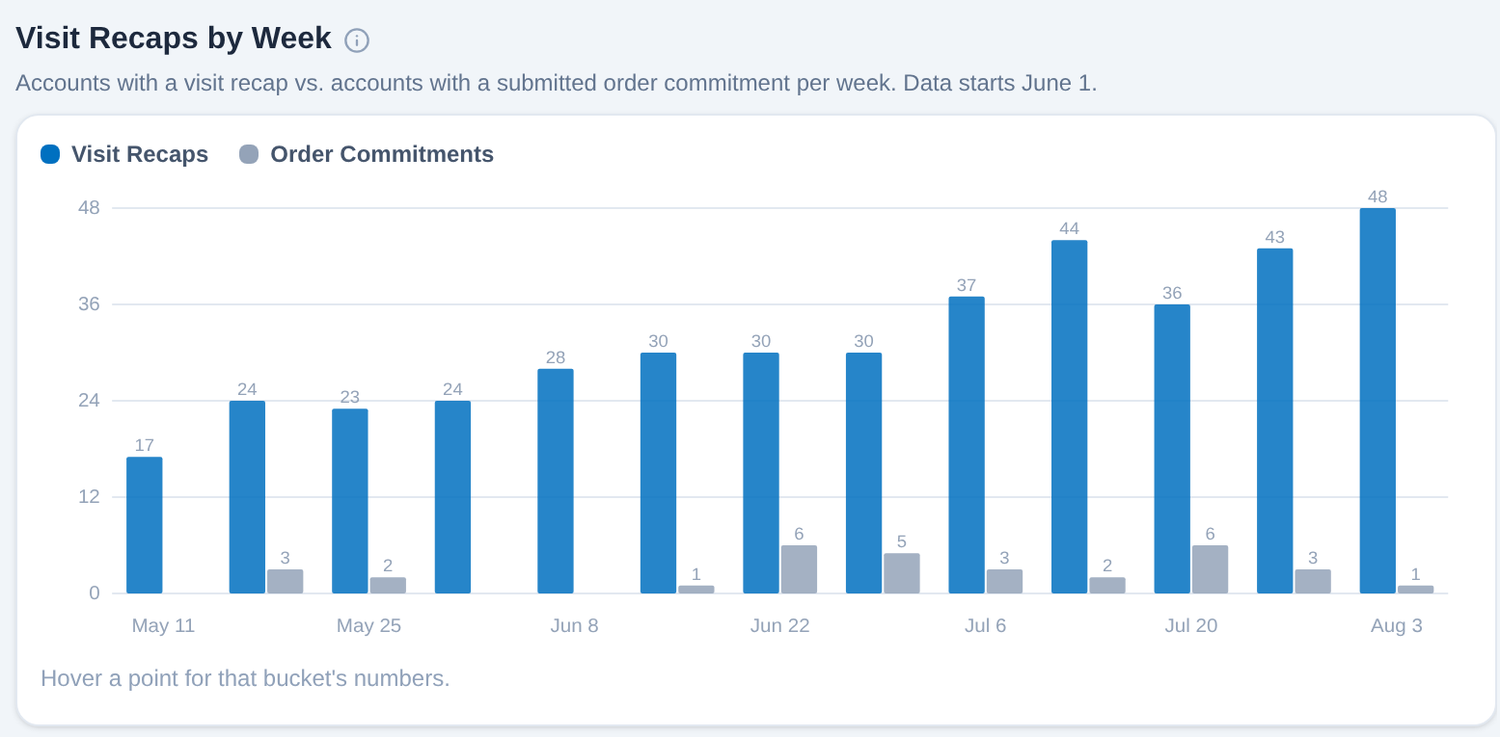
Ruby trends report showing visit recaps versus order commitments per week over three months
New vs. follow-up

Are reps opening new doors or deepening existing accounts? Both curves, at a glance.
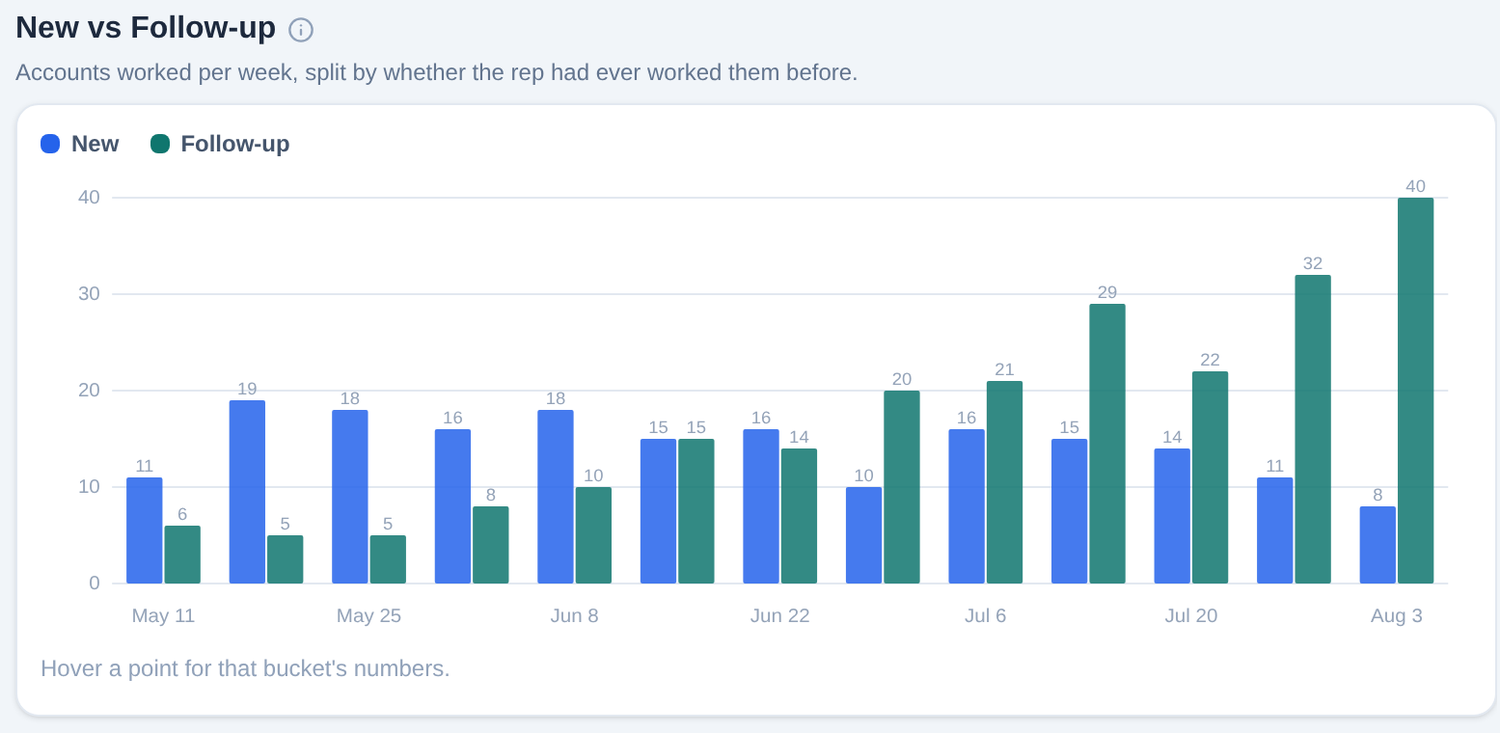
Ruby trends report splitting accounts worked per week into new versus follow-up visits
The Sales Pipeline — from targeted to closed

Every account moves through Targeted → Active → Closed → Follow Up — per brand, per rep, per market. This is the view that turns a supplier check-in from “trust me” into “look.”
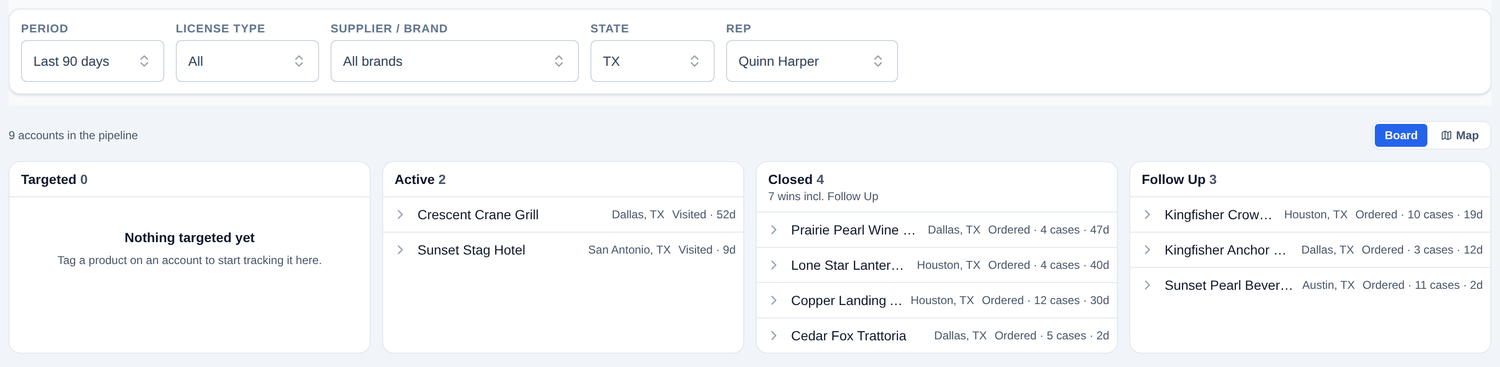
Ruby sales pipeline board showing accounts in targeted, active, closed, and follow-up stages for a rep's Texas territory

Running a broker group on spreadsheets?

See how Ruby replaces the Excel-and-QuickBooks patchwork with one system your brokers — and your suppliers — will actually want to use.

Request a demo

or email sales@rubyprosoftware.com